|
PLearn 0.1
|
|
PLearn 0.1
|
#include <Gnuplot.h>
Public Member Functions | |
| Gnuplot (int max_nb_plot=20) | |
| Gnuplot (const Vec &v1, const string &opt1) | |
| Gnuplot (const Vec &v1, const string &opt1, const Vec &v2, const string &opt2) | |
| Gnuplot (const Vec &v1, const string &opt1, const Vec &v2, const string &opt2, const Vec &v3, const string &opt3) | |
| ~Gnuplot () | |
| PStream & | operator<< (const string &str) |
| void | flush () |
| void | setxrange (real xmin, real xmax) |
| void | setyrange (real ymin, real ymax) |
| void | setrange (real xmin, real xmax, real ymin, real ymax) |
| void | seteps (const string &filename) |
| set to eps mode, will save to specified .eps file | |
| void | plot (const Vec &v1, const string &opt1="") |
| void | plot (const Vec &v1, const string &opt1, const Vec &v2, const string &opt2) |
| void | plot (const Vec &v1, const Vec &v2) |
| void | plot (const Vec &v1, const string &opt1, const Vec &v2, const string &opt2, const Vec &v3, const string &opt3) |
| void | plot (const Vec &v1, const Vec &v2, const Vec &v3) |
| void | plot (const Vec &v1, const string &opt1, const Vec &v2, const string &opt2, const Vec &v3, const string &opt3, const Vec &v4, const string &opt4) |
| void | plot (const Vec &v1, const Vec &v2, const Vec &v3, const Vec &v4) |
| void | plot (const Mat &m1, const string &opt1="") |
| void | plot (const Mat &m1, const string &opt1, const Mat &m2, const string &opt2) |
| void | plot (const Mat &m1, const string &opt1, const Mat &m2, const string &opt2, const Mat &m3, const string &opt3) |
| void | plot (const Mat &m1, const string &opt1, const Mat &m2, const string &opt2, const Mat &m3, const string &opt3, const Mat &m4, const string &opt4) |
| void | plot (const Mat &m1, const string &opt1, const Mat &m2, const string &opt2, const Mat &m3, const string &opt3, const Mat &m4, const string &opt4, const Mat &m5, const string &opt5) |
| void | plot (const Mat &m1, const string &opt1, const Mat &m2, const string &opt2, const Mat &m3, const string &opt3, const Mat &m4, const string &opt4, const Mat &m5, const string &opt5, const Mat &m6, const string &opt6) |
| void | plotClasses (const Mat &m) |
| void | multiplot (vector< Mat * > &ms, vector< string > &opts) |
| void | plot3d (const Mat &m1, const string &opt1="") |
| void | plotcdf (Vec feature, const string &title="cdf") |
| void | plotcdf (const Array< Vec > &vecarray, const Array< string > &titlearray) |
| void | plotdensity (Vec feature, const string &title, int halfwindowsize, string range="") |
| void | plotdensity (const Array< Vec > &vecarray, const Array< string > &titlearray, int halfwindowsize) |
| void | histoplot (Vec feature, real minval, real maxval, int nbins, bool do_normalize=false, char *title="histogram") |
| void | histoplot (Vec feature, Vec classnums, real minval, real maxval, int nbins, bool do_normalize=false) |
| void | featureplot (Mat inputs, Vec classnums, char *withwhat="points") |
| void | featureplot (Mat dataset, char *withwhat="points") |
| void | export_ps (string psfname, string psoptions="eps color") |
Protected Attributes | |
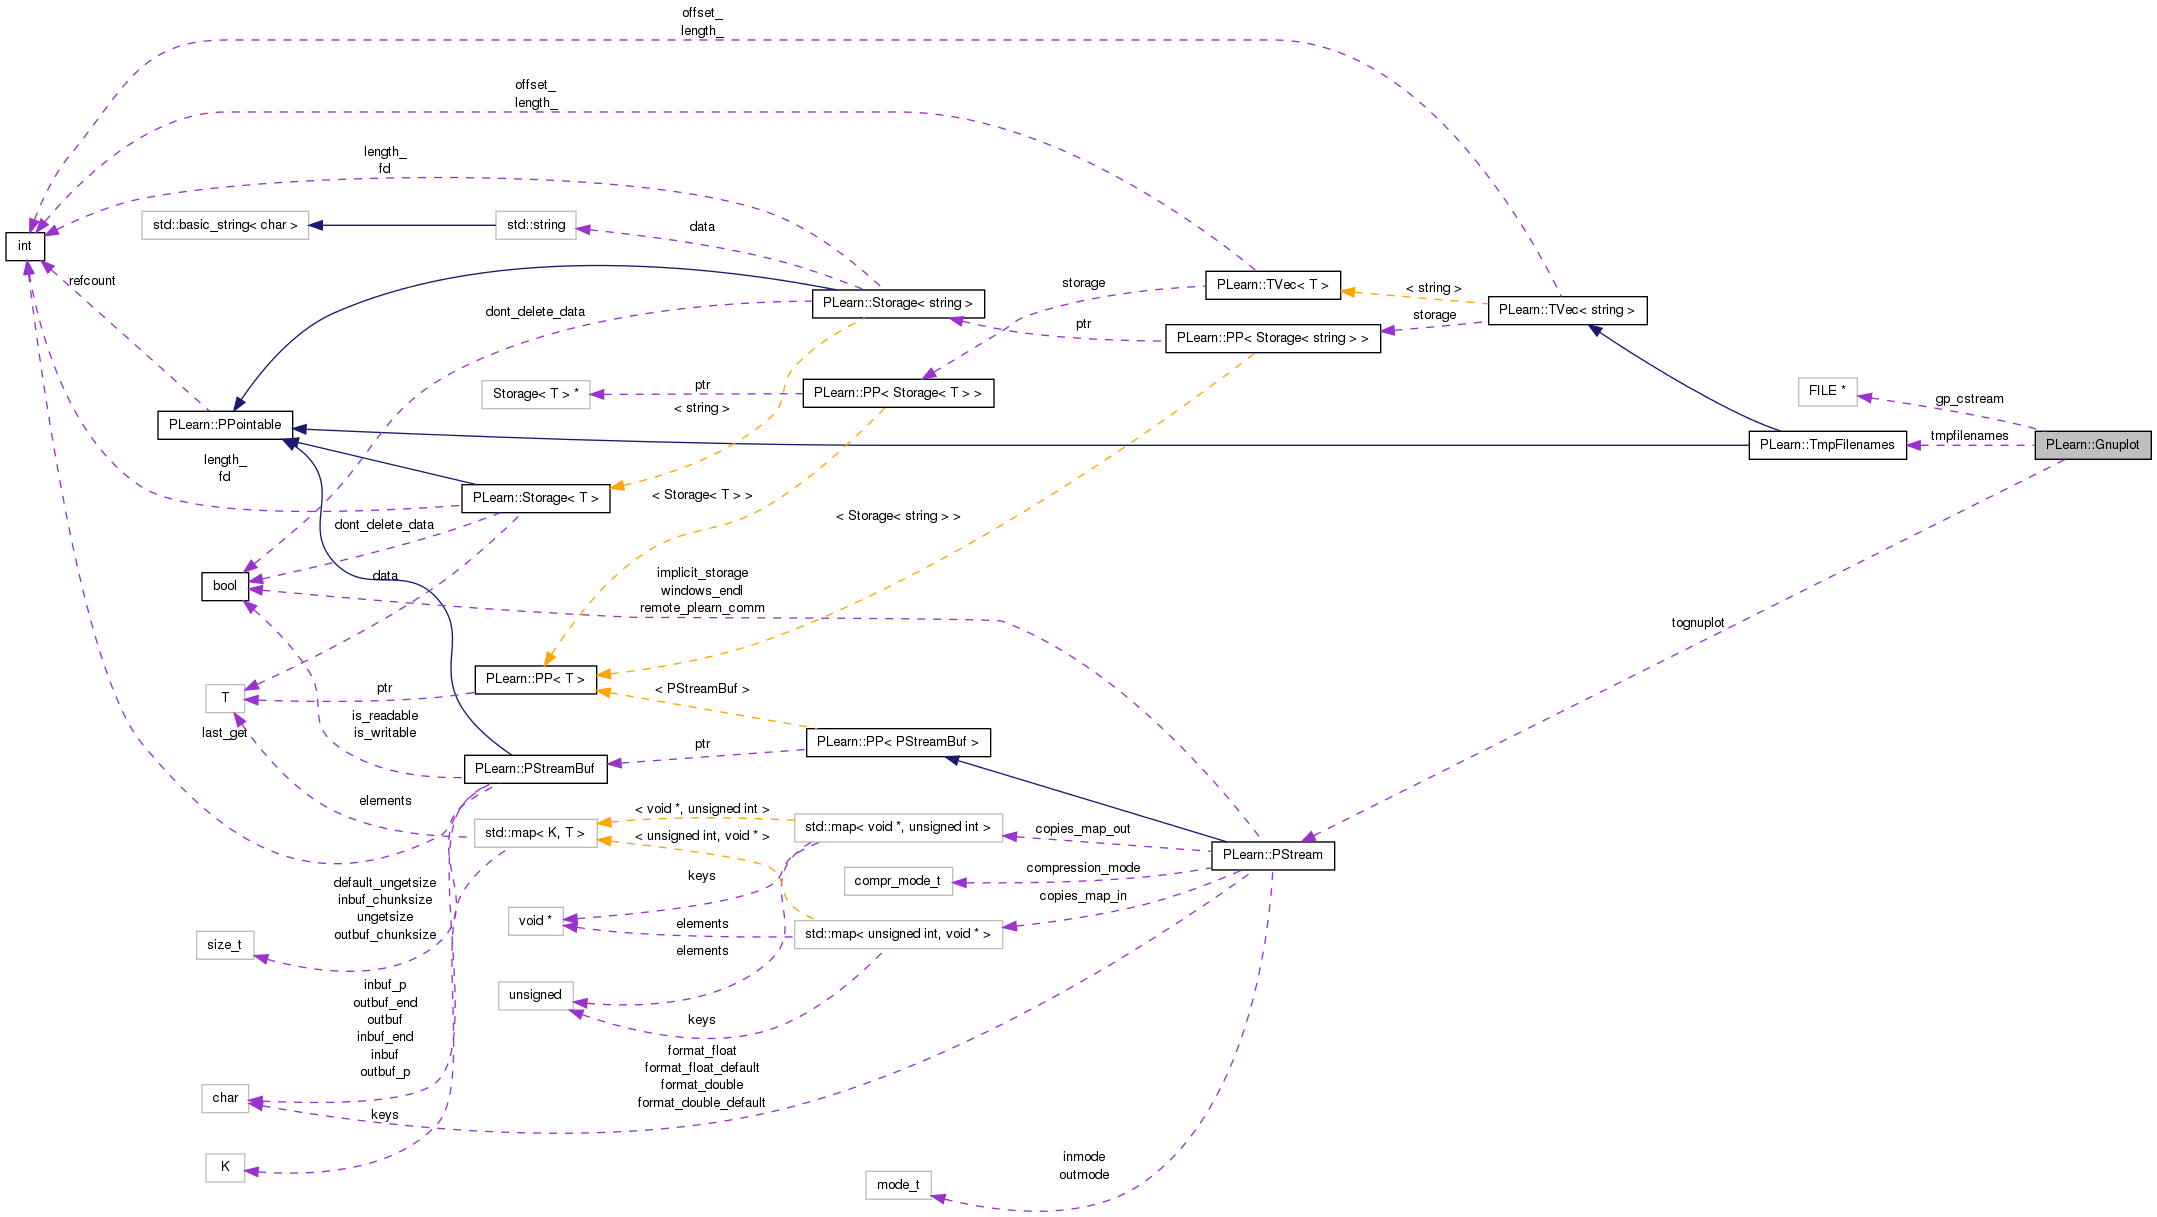
| TmpFilenames | tmpfilenames |
| FILE * | gp_cstream |
| PStream | tognuplot |
| PLearn::Gnuplot::Gnuplot | ( | int | max_nb_plot = 20 | ) |
Definition at line 63 of file Gnuplot.cc.
References PLearn::endl(), gp_cstream, PLearn::PStream::outmode, PLearn::PStream::raw_ascii, and tognuplot.
  : tmpfilenames(nb_max_plot,"/tmp/","gp"),
    gp_cstream(popen("gnuplot","w"))  //, tognuplot(fileno(gp_cstream))
{
  tognuplot = new FdPStreamBuf(-1, fileno(gp_cstream));
  tognuplot.outmode=PStream::raw_ascii;
  tognuplot << "set data style lines" << endl;
}

| PLearn::Gnuplot::Gnuplot | ( | const Vec & | v1, |
| const string & | opt1 | ||
| ) |
Definition at line 72 of file Gnuplot.cc.
References PLearn::endl(), gp_cstream, PLearn::PStream::outmode, plot(), PLearn::PStream::raw_ascii, and tognuplot.
  : tmpfilenames(5,"/tmp/","gp"),
    gp_cstream(popen("gnuplot","w")) //, tognuplot(fileno(gp_cstream))
{
  tognuplot = new FdPStreamBuf(-1, fileno(gp_cstream));
  tognuplot.outmode=PStream::raw_ascii;
  tognuplot << "set data style lines" << endl;
  plot(v1,opt1);
}

| PLearn::Gnuplot::Gnuplot | ( | const Vec & | v1, |
| const string & | opt1, | ||
| const Vec & | v2, | ||
| const string & | opt2 | ||
| ) |
Definition at line 82 of file Gnuplot.cc.
References PLearn::endl(), gp_cstream, PLearn::PStream::outmode, plot(), PLearn::PStream::raw_ascii, and tognuplot.
  : tmpfilenames(5,"/tmp/","gp"),
    gp_cstream(popen("gnuplot","w")) //,    tognuplot(fileno(gp_cstream))
{
  tognuplot = new FdPStreamBuf(-1, fileno(gp_cstream));
  tognuplot.outmode=PStream::raw_ascii;
  tognuplot << "set data style lines" << endl;
  plot(v1,opt1,v2,opt2);
}

| PLearn::Gnuplot::Gnuplot | ( | const Vec & | v1, |
| const string & | opt1, | ||
| const Vec & | v2, | ||
| const string & | opt2, | ||
| const Vec & | v3, | ||
| const string & | opt3 | ||
| ) |
Definition at line 92 of file Gnuplot.cc.
References PLearn::endl(), gp_cstream, PLearn::PStream::outmode, plot(), PLearn::PStream::raw_ascii, and tognuplot.
  : tmpfilenames(5,"/tmp/","gp"),
    gp_cstream(popen("gnuplot","w")) //,    tognuplot(fileno(gp_cstream))
{
  tognuplot = new FdPStreamBuf(-1, fileno(gp_cstream));
  tognuplot.outmode=PStream::raw_ascii;
  tognuplot << "set data style lines" << endl;
  plot(v1,opt1,v2,opt2,v3,opt3);
}

| PLearn::Gnuplot::~Gnuplot | ( | ) |
Definition at line 103 of file Gnuplot.cc.
References PLearn::endl(), gp_cstream, and tognuplot.
{
  tognuplot << "\nquit" << endl;
  pclose(gp_cstream);
}

| void PLearn::Gnuplot::export_ps | ( | string | psfname, |
| string | psoptions = "eps color" |
||
| ) |
Definition at line 463 of file Gnuplot.cc.
References PLearn::endl(), and tognuplot.
{
  tognuplot << "set terminal postscript " << psoptions << "\n"
            << "set output '" << psfname << "'\n"
            << "replot\n"
            << "set output\n"
            << "set terminal x11" << endl;
}

Plots each input feature (column of inputs), with the different values it takes in the dataset and with a different color for each class
Definition at line 361 of file Gnuplot.cc.
References c, PLearn::endl(), i, j, PLearn::TMat< T >::length(), PLearn::max(), tmpfilenames, tognuplot, and PLearn::TMat< T >::width().
{
  ofstream out(tmpfilenames[0].c_str());

  int nclasses = (int)max(classnums) + 1;

  for(int c=0; c<nclasses; c++)
    {
      for(int i=0; i<inputs.length(); i++)
        if((int)classnums[i] == c)
          for(int j=0; j<inputs.width(); j++)
            out << j << ' ' << inputs(i,j) << endl;
      out << endl;
    }

  tognuplot << "plot '" << tmpfilenames[0] << "' every PLearn:::0::0 title 'Class 0' with " << withwhat;
  for(int c=1; c<nclasses; c++)
    tognuplot << ", '" << tmpfilenames[0] << "' every PLearn:::" << c << "::" << c
              << "  title 'Class " << c << "' with " << withwhat;
  tognuplot << endl;
}

| void PLearn::Gnuplot::featureplot | ( | Mat | dataset, |
| char * | withwhat = "points" |
||
| ) | [inline] |
Definition at line 121 of file Gnuplot.h.
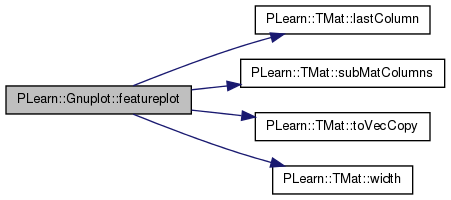
References PLearn::TMat< T >::lastColumn(), PLearn::TMat< T >::subMatColumns(), PLearn::TMat< T >::toVecCopy(), and PLearn::TMat< T >::width().
    {
      featureplot(dataset.subMatColumns(0,dataset.width()-1),
                  dataset.lastColumn().toVecCopy(), withwhat);
    }
| void PLearn::Gnuplot::flush | ( | ) |
Definition at line 115 of file Gnuplot.cc.
References PLearn::PStream::flush(), and tognuplot.
{ tognuplot.flush(); }

| void PLearn::Gnuplot::histoplot | ( | Vec | feature, |
| Vec | classnums, | ||
| real | minval, | ||
| real | maxval, | ||
| int | nbins, | ||
| bool | do_normalize = false |
||
| ) |
Definition at line 326 of file Gnuplot.cc.
References c, PLearn::endl(), i, PLearn::TVec< T >::length(), PLearn::max(), PLearn::normalize(), tmpfilenames, and tognuplot.
{
  ofstream out(tmpfilenames[0].c_str());
  int nclasses = (int)max(classnums) + 1;
  real binwidth = (maxval-minval)/nbins;
  real deltaval = maxval-minval+ 1e-6;

  Mat histo(nclasses, nbins);
  for(int i=0; i<feature.length(); i++)
    {
      real val = feature[i];
      int binpos = int((val-minval)/deltaval*nbins);
      if(binpos>=0 && binpos<nbins)
        histo(int(classnums[i]),binpos)++;
    }

  if(do_normalize)
    normalize(histo,real(1.0));

  for(int c=0; c<nclasses; c++)
    {
      for(int i=0; i<nbins; i++)
        out << minval+(0.5+i)*binwidth << " " << histo(c,i) << " " << binwidth
            << endl;
      out << endl;
    }

  tognuplot << "plot '" << tmpfilenames[0] << "' every PLearn:::0::0 title 'Class 0' with boxes";
  for(int c=1; c<nclasses; c++)
    tognuplot << ", '" << tmpfilenames[0] << "' every PLearn:::" << c << "::" << c
              << "  title 'Class " << c << "' with boxes";
  tognuplot << endl;
}
| void PLearn::Gnuplot::histoplot | ( | Vec | feature, |
| real | minval, | ||
| real | maxval, | ||
| int | nbins, | ||
| bool | do_normalize = false, |
||
| char * | title = "histogram" |
||
| ) |
Definition at line 310 of file Gnuplot.cc.
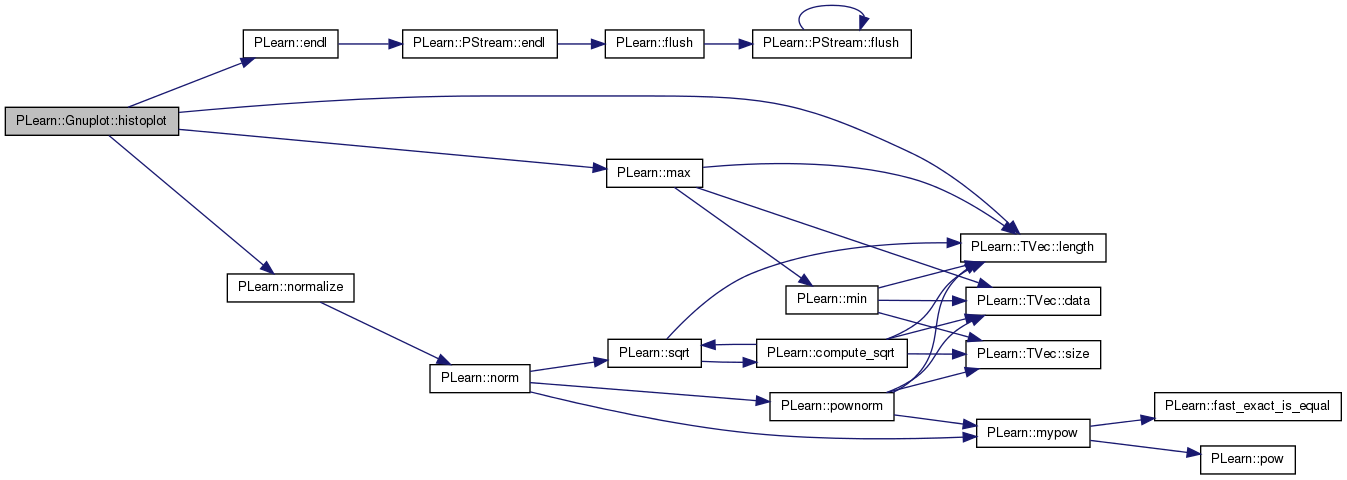
References PLearn::endl(), PLearn::histogram(), i, PLearn::normalize(), tmpfilenames, and tognuplot.
{
  ofstream out(tmpfilenames[0].c_str());
  Vec histo = histogram(feature, minval, maxval, nbins);
  if(do_normalize)
    normalize(histo,real(1.0));
  real binwidth = (maxval-minval)/nbins;

  for(int i=0; i<nbins; i++)
    out << minval + (0.5+i)*binwidth + 0.5 << " " << histo[i] << " " << binwidth << endl;
    //out << minval+(0.5+i)*nbins << " " << histo[i] << " " << binwidth << endl;

  tognuplot << "plot '" << tmpfilenames[0] << "' title '" << title << "' with boxes" << endl;
}

| void PLearn::Gnuplot::multiplot | ( | vector< Mat * > & | ms, |
| vector< string > & | opts | ||
| ) |
Definition at line 290 of file Gnuplot.cc.
References PLearn::endl(), i, PLearn::saveGnuplot(), tmpfilenames, and tognuplot.
{
  tognuplot << "plot ";
  for (unsigned int i = 0; i < ms.size(); ++i) {
    saveGnuplot(tmpfilenames[i].c_str(), *(ms[i]));
    if (i) tognuplot << ", ";
    tognuplot << "'" << tmpfilenames[i] << "' " << opts[i];
  }
  tognuplot << endl;
}

| PStream & PLearn::Gnuplot::operator<< | ( | const string & | str | ) |
Definition at line 109 of file Gnuplot.cc.
References tognuplot.
| void PLearn::Gnuplot::plot | ( | const Vec & | v1, |
| const string & | opt1, | ||
| const Vec & | v2, | ||
| const string & | opt2 | ||
| ) |
Definition at line 143 of file Gnuplot.cc.
References PLearn::endl(), PLearn::saveGnuplot(), tmpfilenames, and tognuplot.
{
  saveGnuplot(tmpfilenames[0].c_str(), v1);
  chmod(tmpfilenames[0].c_str(),0777);
  saveGnuplot(tmpfilenames[1].c_str(), v2);
  chmod(tmpfilenames[1].c_str(),0777);
  tognuplot << "plot '" << tmpfilenames[0] << "' " << opt1 << ", '" << tmpfilenames[1] << "' " << opt2 << endl;
}

| void PLearn::Gnuplot::plot | ( | const Mat & | m1, |
| const string & | opt1, | ||
| const Mat & | m2, | ||
| const string & | opt2, | ||
| const Mat & | m3, | ||
| const string & | opt3 | ||
| ) |
Definition at line 188 of file Gnuplot.cc.
References PLearn::endl(), PLearn::saveGnuplot(), tmpfilenames, and tognuplot.
{
  saveGnuplot(tmpfilenames[0].c_str(), m1);
  saveGnuplot(tmpfilenames[1].c_str(), m2);
  saveGnuplot(tmpfilenames[2].c_str(), m3);
  string command = "plot '" + tmpfilenames[0] + "' " + opt1 + ", " +
    "'" + tmpfilenames[1] + "' " + opt2 + ", " +
    "'" + tmpfilenames[2] + "' " + opt3;
  // cerr << command << endl;
  tognuplot << command << endl;
}

| void PLearn::Gnuplot::plot | ( | const Mat & | m1, |
| const string & | opt1, | ||
| const Mat & | m2, | ||
| const string & | opt2, | ||
| const Mat & | m3, | ||
| const string & | opt3, | ||
| const Mat & | m4, | ||
| const string & | opt4 | ||
| ) |
Definition at line 208 of file Gnuplot.cc.
References PLearn::endl(), PLearn::saveGnuplot(), tmpfilenames, and tognuplot.
{
  saveGnuplot(tmpfilenames[0].c_str(), m1);
  saveGnuplot(tmpfilenames[1].c_str(), m2);
  saveGnuplot(tmpfilenames[2].c_str(), m3);
  saveGnuplot(tmpfilenames[3].c_str(), m4);
  tognuplot << "plot '" << tmpfilenames[0] << "' " << opt1 << ", ";
  tognuplot << "'" << tmpfilenames[1] << "' " << opt2 << ", ";
  tognuplot << "'" << tmpfilenames[2] << "' " << opt3 << ", ";
  tognuplot << "'" << tmpfilenames[3] << "' " << opt4 << endl;
}

| void PLearn::Gnuplot::plot | ( | const Mat & | m1, |
| const string & | opt1, | ||
| const Mat & | m2, | ||
| const string & | opt2, | ||
| const Mat & | m3, | ||
| const string & | opt3, | ||
| const Mat & | m4, | ||
| const string & | opt4, | ||
| const Mat & | m5, | ||
| const string & | opt5 | ||
| ) |
Definition at line 220 of file Gnuplot.cc.
References PLearn::endl(), PLearn::saveGnuplot(), tmpfilenames, and tognuplot.
{
  saveGnuplot(tmpfilenames[0].c_str(), m1);
  saveGnuplot(tmpfilenames[1].c_str(), m2);
  saveGnuplot(tmpfilenames[2].c_str(), m3);
  saveGnuplot(tmpfilenames[3].c_str(), m4);
  saveGnuplot(tmpfilenames[4].c_str(), m5);
  tognuplot << "plot '" << tmpfilenames[0] << "' " << opt1 << ", ";
  tognuplot << "'" << tmpfilenames[1] << "' " << opt2 << ", ";
  tognuplot << "'" << tmpfilenames[2] << "' " << opt3 << ", ";
  tognuplot << "'" << tmpfilenames[3] << "' " << opt4 << ", ";
  tognuplot << "'" << tmpfilenames[4] << "' " << opt5 << endl;
}

| void PLearn::Gnuplot::plot | ( | const Mat & | m1, |
| const string & | opt1, | ||
| const Mat & | m2, | ||
| const string & | opt2, | ||
| const Mat & | m3, | ||
| const string & | opt3, | ||
| const Mat & | m4, | ||
| const string & | opt4, | ||
| const Mat & | m5, | ||
| const string & | opt5, | ||
| const Mat & | m6, | ||
| const string & | opt6 | ||
| ) |
Definition at line 235 of file Gnuplot.cc.
References PLearn::endl(), PLearn::saveGnuplot(), tmpfilenames, and tognuplot.
{
  saveGnuplot(tmpfilenames[0].c_str(), m1);
  saveGnuplot(tmpfilenames[1].c_str(), m2);
  saveGnuplot(tmpfilenames[2].c_str(), m3);
  saveGnuplot(tmpfilenames[3].c_str(), m4);
  saveGnuplot(tmpfilenames[4].c_str(), m5);
  saveGnuplot(tmpfilenames[5].c_str(), m6);
  tognuplot << "plot '" << tmpfilenames[0] << "' " << opt1 << ", ";
  tognuplot << "'" << tmpfilenames[1] << "' " << opt2 << ", ";
  tognuplot << "'" << tmpfilenames[2] << "' " << opt3 << ", ";
  tognuplot << "'" << tmpfilenames[3] << "' " << opt4 << ", ";
  tognuplot << "'" << tmpfilenames[4] << "' " << opt5 << ", ";
  tognuplot << "'" << tmpfilenames[5] << "' " << opt6 << endl;
}

| void PLearn::Gnuplot::plot | ( | const Vec & | v1, |
| const string & | opt1, | ||
| const Vec & | v2, | ||
| const string & | opt2, | ||
| const Vec & | v3, | ||
| const string & | opt3 | ||
| ) |
Definition at line 152 of file Gnuplot.cc.
References PLearn::endl(), PLearn::saveGnuplot(), tmpfilenames, and tognuplot.
{
  saveGnuplot(tmpfilenames[0].c_str(), v1);
  chmod(tmpfilenames[0].c_str(),0777);
  saveGnuplot(tmpfilenames[1].c_str(), v2);
  chmod(tmpfilenames[1].c_str(),0777);
  saveGnuplot(tmpfilenames[2].c_str(), v3);
  chmod(tmpfilenames[2].c_str(),0777);
  tognuplot << "plot '" << tmpfilenames[0] << "' " << opt1
            << ", '" << tmpfilenames[1] << "' " << opt2
            << ", '" << tmpfilenames[2] << "' " << opt3 << endl;
}

| void PLearn::Gnuplot::plot | ( | const Mat & | m1, |
| const string & | opt1 = "" |
||
| ) |
Definition at line 181 of file Gnuplot.cc.
References PLearn::endl(), PLearn::saveGnuplot(), tmpfilenames, and tognuplot.
{
  saveGnuplot(tmpfilenames[0].c_str(), m1);
  tognuplot << "plot '"<< tmpfilenames[0] << "' " << opt1 << endl;
}

| void PLearn::Gnuplot::plot | ( | const Vec & | v1, |
| const string & | opt1 = "" |
||
| ) |
Definition at line 136 of file Gnuplot.cc.
References PLearn::endl(), PLearn::saveGnuplot(), tmpfilenames, and tognuplot.
Referenced by PLearn::displayHistogram(), Gnuplot(), and PLearn::interactiveDisplayCDF().
{
  saveGnuplot(tmpfilenames[0].c_str(), v1);
  chmod(tmpfilenames[0].c_str(),0777);
  tognuplot << "plot '" << tmpfilenames[0] << "' " << opt1 << endl;
}


| void PLearn::Gnuplot::plot | ( | const Vec & | v1, |
| const string & | opt1, | ||
| const Vec & | v2, | ||
| const string & | opt2, | ||
| const Vec & | v3, | ||
| const string & | opt3, | ||
| const Vec & | v4, | ||
| const string & | opt4 | ||
| ) |
Definition at line 165 of file Gnuplot.cc.
References PLearn::endl(), PLearn::saveGnuplot(), tmpfilenames, and tognuplot.
{
  saveGnuplot(tmpfilenames[0].c_str(), v1);
  chmod(tmpfilenames[0].c_str(),0777);
  saveGnuplot(tmpfilenames[1].c_str(), v2);
  chmod(tmpfilenames[1].c_str(),0777);
  saveGnuplot(tmpfilenames[2].c_str(), v3);
  chmod(tmpfilenames[2].c_str(),0777);
  saveGnuplot(tmpfilenames[3].c_str(), v4);
  chmod(tmpfilenames[3].c_str(),0777);
  tognuplot << "plot '" << tmpfilenames[0] << "' " << opt1
            << ", '" << tmpfilenames[1] << "' " << opt2
            << ", '" << tmpfilenames[2] << "' " << opt3
            << ", '" << tmpfilenames[3] << "' " << opt4 << endl;
}

| void PLearn::Gnuplot::plot | ( | const Mat & | m1, |
| const string & | opt1, | ||
| const Mat & | m2, | ||
| const string & | opt2 | ||
| ) |
Definition at line 200 of file Gnuplot.cc.
References PLearn::endl(), PLearn::saveGnuplot(), tmpfilenames, and tognuplot.
{
  saveGnuplot(tmpfilenames[0].c_str(), m1);
  saveGnuplot(tmpfilenames[1].c_str(), m2);
  tognuplot << "plot '" << tmpfilenames[0] << "' " << opt1 << ", ";
  tognuplot << "'" << tmpfilenames[1] << "' " << opt2 << endl;
}

| void PLearn::Gnuplot::plot3d | ( | const Mat & | m1, |
| const string & | opt1 = "" |
||
| ) |
Definition at line 301 of file Gnuplot.cc.
References PLearn::endl(), PLearn::saveGnuplot(), tmpfilenames, and tognuplot.
{
    //tognuplot << "set contour" << endl;
    tognuplot << "set dgrid3d" << endl;
    //tognuplot << "set isosamples 10, 10" << endl;
    saveGnuplot(tmpfilenames[0].c_str(), m1);
    tognuplot << "splot '" << tmpfilenames[0] << "' " << opt1 << endl;
}

| void PLearn::Gnuplot::plotcdf | ( | Vec | feature, |
| const string & | title = "cdf" |
||
| ) |
Definition at line 383 of file Gnuplot.cc.
References PLearn::TVec< T >::copy(), PLearn::endl(), i, PLearn::TVec< T >::length(), PLearn::sortElements(), tmpfilenames, and tognuplot.
{
  Vec v = feature.copy();
  sortElements(v);
  ofstream out(tmpfilenames[0].c_str());
  // out << "0 0\n";
  for(int i=0; i<v.length(); i++)
    out << v[i] << ' ' << real(i+1)/v.length() << '\n';
  out.close();
  tognuplot << "plot '" << tmpfilenames[0] << "' using 1:2 title '" << title << "' with impulses" << endl;
}

Definition at line 395 of file Gnuplot.cc.
References c, PLearn::TVec< T >::copy(), PLearn::endl(), i, PLearn::TVec< T >::length(), PLearn::TVec< T >::size(), PLearn::sortElements(), tmpfilenames, and tognuplot.
{
  tognuplot << "plot ";
  for(int c=0; c<vecarray.size(); c++)
  {
    Vec v = vecarray[c].copy();
    sortElements(v);
    ofstream out(tmpfilenames[c].c_str());
    for(int i=0; i<v.length(); i++)
      out << v[i] << ' ' << real(i+1)/v.length() << '\n';
    out.close();
    tognuplot << "'" << tmpfilenames[c] << "' using 1:2 title '" << titlearray[c] << "'";
    if(c==vecarray.size()-1)
      tognuplot << endl;
    else
      tognuplot << ", ";
  }
}

| void PLearn::Gnuplot::plotClasses | ( | const Mat & | m | ) |
Definition at line 253 of file Gnuplot.cc.
References c, PLearn::TMat< T >::copy(), PLearn::endl(), PLearn::fast_exact_is_equal(), i, PLearn::TMat< T >::length(), PLERROR, PLearn::sortRows(), tmpfilenames, tognuplot, PLearn::tostring(), and x.
{
  Mat s = m.copy();
  sortRows(s, 2);
  string fname = tmpfilenames[0];
  int l = s.length();
  string command = "plot ";
  ofstream out(fname.c_str());
  if(!out)
    PLERROR("Could not open file %s for writing ", fname.c_str());

  real oldc = FLT_MAX;
  int index = 0;
  for(int i=0; i<l; i++)
    {
      real x = s(i,0);
      real y = s(i,1);
      real c = s(i,2);
      if(!fast_exact_is_equal(c, oldc))
        {
          if(i>0)
            {
              out << "\n\n";
              command += ", ";
            }
          command += "'" + fname + "' index " + tostring(index) + " title '" + tostring(c) + "' with points";
          ++index;
        }
      out << x << " " << y << " " << c << "\n";
      oldc = c;
    }
  out.close();

  //  cerr <<  command << endl;
  tognuplot << command << endl;
}

| void PLearn::Gnuplot::plotdensity | ( | Vec | feature, |
| const string & | title, | ||
| int | halfwindowsize, | ||
| string | range = "" |
||
| ) |
Definition at line 414 of file Gnuplot.cc.
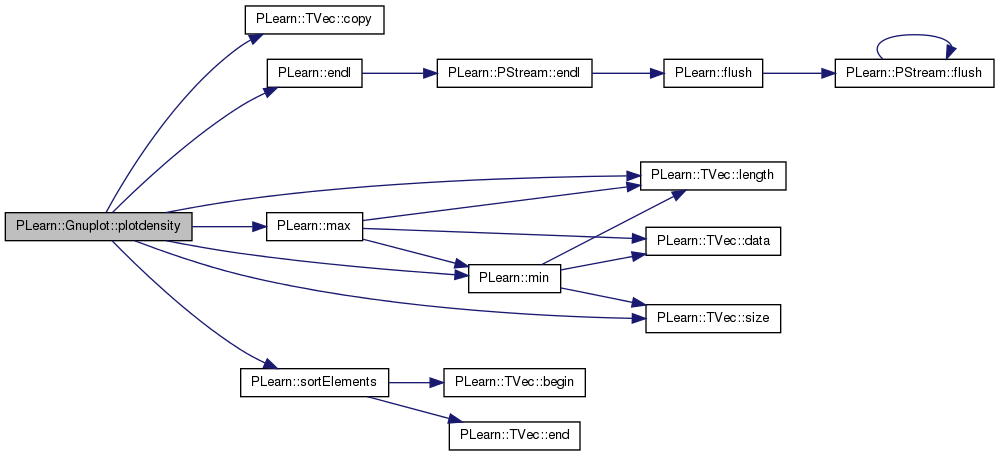
References PLearn::TVec< T >::copy(), PLearn::endl(), PLearn::fast_exact_is_equal(), i, PLearn::TVec< T >::length(), PLearn::max(), PLearn::min(), PLERROR, PLearn::sortElements(), tmpfilenames, tognuplot, and x.
{
  Vec v = feature.copy();
  sortElements(v);
  ofstream out(tmpfilenames[0].c_str());
  for (int i=1; i<v.length()-1; i++)
  {
    real x = v[i];
    int lowi = std::max(i-halfwindowsize,1);
    int highi = std::min(i+halfwindowsize,v.length()-2);
    real lowx = 0.5*(v[lowi-1]+v[lowi]);
    real highx = 0.5*(v[highi+1]+v[highi]);
    if (fast_exact_is_equal(highx, lowx))
      PLERROR("In Gnuplot::plotdensity(...), density at this point is inf, use larger windowsize");
    real density = (highi-lowi+1)/(highx-lowx);
    out << x << ' ' << density << "\n";
  }
  out.close();
  tognuplot << "plot " << range << " '" << tmpfilenames[0] << "' title '" << title << "' with lines" << endl;
}
| void PLearn::Gnuplot::plotdensity | ( | const Array< Vec > & | vecarray, |
| const Array< string > & | titlearray, | ||
| int | halfwindowsize | ||
| ) |
Definition at line 435 of file Gnuplot.cc.
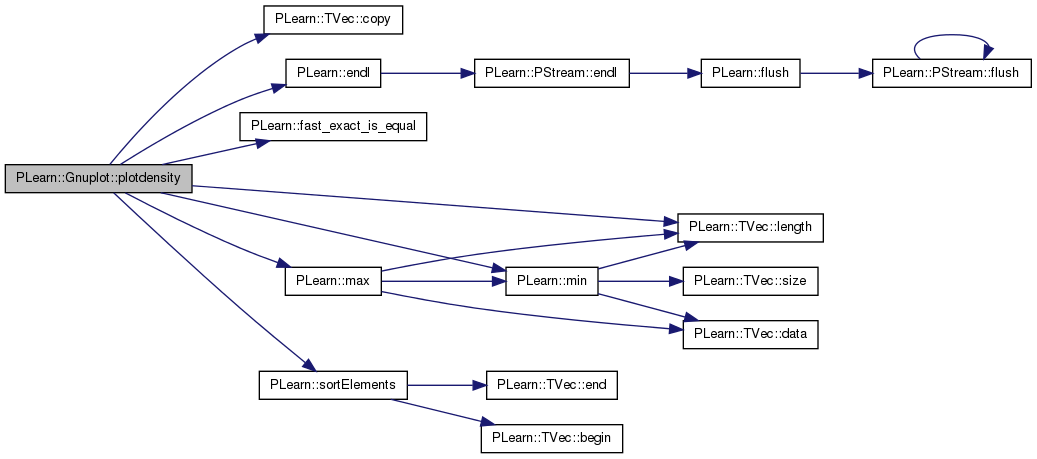
References c, PLearn::TVec< T >::copy(), PLearn::endl(), i, PLearn::TVec< T >::length(), PLearn::max(), PLearn::min(), PLearn::TVec< T >::size(), PLearn::sortElements(), tmpfilenames, tognuplot, and x.
{
  tognuplot << "plot ";
  for(int c=0; c<vecarray.size(); c++)
  {
    Vec v = vecarray[c].copy();
    sortElements(v);
    ofstream out(tmpfilenames[c].c_str());
    for (int i=1; i<v.length()-1; i++)
    {
      real x = v[i];
      int lowi = std::max(i-halfwindowsize,1);
      int highi = std::min(i+halfwindowsize,v.length()-2);
      real lowx = 0.5*(v[lowi-1]+v[lowi]);
      real highx = 0.5*(v[highi+1]+v[highi]);
      real density = (highi-lowi+1)/(highx-lowx);
      out << x << ' ' << density << "\n";
    }
    out.close();
    tognuplot << "'" << tmpfilenames[c] << "' using 1:2 title '" << titlearray[c] << "'";
    if(c==vecarray.size()-1)
      tognuplot << endl;
    else
      tognuplot << ", ";
  }
}
| void PLearn::Gnuplot::seteps | ( | const string & | filename | ) |
set to eps mode, will save to specified .eps file
Definition at line 130 of file Gnuplot.cc.
References PLearn::endl(), and tognuplot.
{
  tognuplot << "set term post color" << endl;
  tognuplot << "set output \"" << filename << "\"" << endl;
}

Definition at line 124 of file Gnuplot.cc.
References setxrange(), and setyrange().

Definition at line 118 of file Gnuplot.cc.
References PLearn::endl(), and tognuplot.
Referenced by setrange().


Definition at line 121 of file Gnuplot.cc.
References PLearn::endl(), and tognuplot.
Referenced by setrange().


FILE* PLearn::Gnuplot::gp_cstream [protected] |
Definition at line 64 of file Gnuplot.h.
Referenced by Gnuplot(), and ~Gnuplot().
TmpFilenames PLearn::Gnuplot::tmpfilenames [protected] |
Definition at line 63 of file Gnuplot.h.
Referenced by featureplot(), histoplot(), multiplot(), plot(), plot3d(), plotcdf(), plotClasses(), and plotdensity().
PStream PLearn::Gnuplot::tognuplot [protected] |
Definition at line 65 of file Gnuplot.h.
Referenced by export_ps(), featureplot(), flush(), Gnuplot(), histoplot(), multiplot(), operator<<(), plot(), plot3d(), plotcdf(), plotClasses(), plotdensity(), seteps(), setxrange(), setyrange(), and ~Gnuplot().
 1.7.4
1.7.4